Equities, Volatility and the ‘Nifty 50’: A Market Outlook
August 27, 2025
Is it 1972 all over again?
By Donald Townswick, CFA, Managing Director - Equity Strategies
Equity markets experienced significant volatility in the first half in 2025, highlighted by President Trump’s April 2 declaration of “Liberation Day” and the sweeping imposition of blanket tariffs. That helped drive the S&P 500 Index down 7.7% within a week, although it has since recovered and is in positive territory for the year. However, other drivers of volatility remain, and investors may wonder if this volatility will lead to greater market instability.
Some suggest conditions are similar to those of the tech bubble of the late 1990s, an event that caused significant losses for many tech-stock investors. However, we think current conditions more closely resemble those preceding the decline of the “Nifty 50” stocks in the early 1970s, and that period offers more relevant insights into what we might expect in equity markets in the coming months.
Today’s Volatility Drivers: Tariffs, War, Earnings
One thing is indisputable: markets HATE uncertainty. The uncertainties listed below are feeding current volatility.
- Tariffs – Manufacturers will likely absorb part of the cost of any imposed tariffs, with consumers bearing the rest. The exact split remains uncertain. If consumers shift toward U.S.-made goods, it could strengthen the U.S. dollar and lead to deflation, potentially offsetting inflation caused by the tariffs. Conversely, if that shift does not occur, tariffs may simply result in an increase in inflation for U.S. consumers without delivering any of the potential benefits (manufacturing “re-shoring” among others).
- Conflict in the Middle East – a seemingly never-ending issue, but the events in the Iran-Israel skirmishes caused only a short-term spike in volatility (as measured by the VIX volatility index) and oil prices.
- Tax cut extensions – The tax cuts included in the 2017 TCJA are now permanent, removing this uncertainty, but concerns remain about potential growth in the Federal budget deficit.
- Slumping earnings outlook - S&P 500 earnings expectations for 2025 are down, dropping by 37% since July 2024 (to 9.3% from 14.7%), while 2026 expectations remain steady at 13.5%.1 The market is uncertain about the sustainability of current market multiples if earnings do not hold up.
What is next in equities? We suggest revisiting the events of 1972.

Mag 7 Versus the Nifty 50

However, at the end of 1972, the Nifty 50 crashed. Many of the stocks fell in value for more than two years. Most of the firms no longer exist, being taken over by other companies. The market impact was significant: the Dow Jones Industrial Average crossed the 1,000 threshold during 1972, but it did not reach that level again for another 10 years.
What caused the crash? Likely causes include the “stagflation” that began in 1971 (high inflation combined with high unemployment), along with President Nixon’s August 1971 introduction of a 90-day wage and price controls order and 10% import surcharge amid the collapse of the Bretton Woods system. These events helped weaken an economy still reeling from the recession of 1969-70, and this period of economic uncertainty sapped investor confidence. The Nifty 50 took the brunt of the market downturn.
Common Feature: Stretched Valuations
The Nifty 50 had an average price-to-earnings (P/E) ratio (by some estimates) of between 43 and 50 times at its peak.2 Investors characterized Nifty 50 stocks by a “buy and never sell” mentality that made for ever-increasing valuations as more money piled in. Analysts estimate that, at its apex, the five largest stocks in the Nifty 50 made up about 25% of the S&P 500.3 Coincidentally, the five largest stocks in the Mag 7 are also about 28% of today’s S&P 500 (with a P/E ratio of 37).Both the Nifty 50 and the Mag 7 stocks were/are very high quality in terms of their income and balance sheets, and solid earnings and low leverage were alluring prospects for both institutional and retail investors. However, both collections also had an average dividend yield much lower than the market. We believe that a steady and material dividend stream acts as a cushion when the markets fall, and neither stock group had/has this cushion.
Is this beginning to sound familiar: high valuations in a select group of quality stocks with the rest of the market lagging? Government intervention with expected short-term pain in the hope of longer-term economic success? Potential stagflation on the horizon? The comparisons to today’s market environment seem compelling.
Will the market today repeat the post-Nifty 50 bear market? It’s possible, but we don’t believe it’s likely.
The “Flying” Isn’t as High This Time
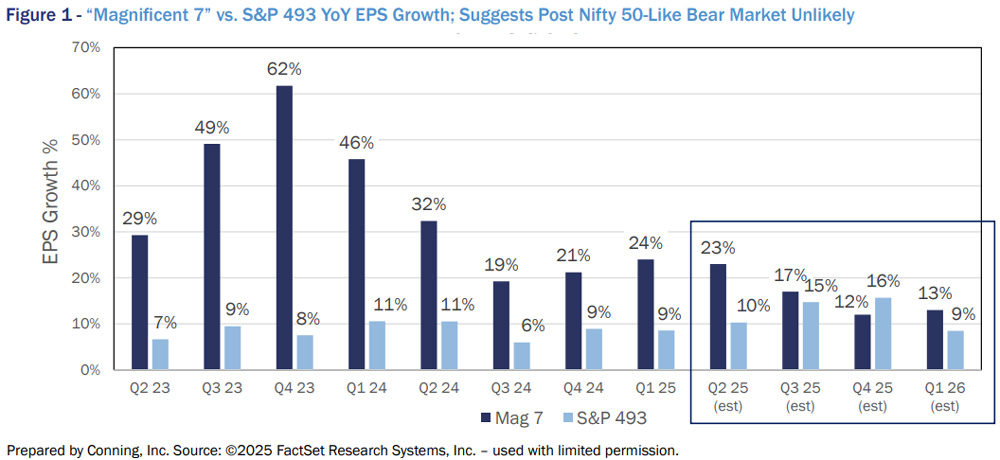
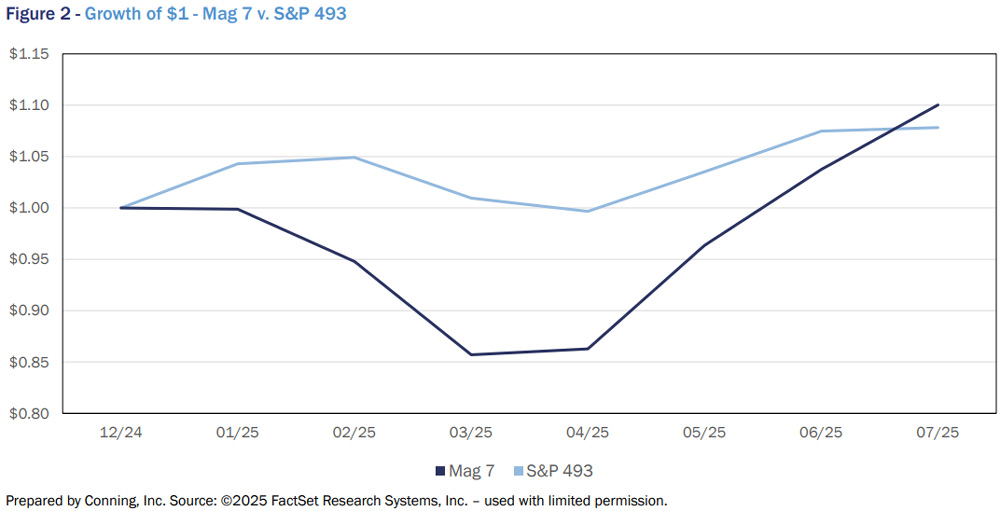
The MAG 7’s valuations may be high on average, but they aren’t as high as the Nifty 50’s. We can also see a difference in earnings growth. As Figure 1 illustrates, Mag 7 earnings over the last several years were nothing short of phenomenal. From Q2 2023 - estimated Q2 2025, they averaged earnings growth of 34%. In comparison, estimates of the Nifty 50’s annual earnings per share (EPS) growth are around 22%, while the rest of the S&P 500 was growing earnings at a paltry 6% on average.We can also see the drop in earnings expectations for the Mag 7 in conjunction with significant increases in expected earnings for the rest of the S&P 500 (including estimates of EPS growth for the next four quarters). While the Mag 7 are still expected to grow earnings at a higher rate than the S&P 493, the gap in earnings growth between the two groups is expected to shrink, implying that the P/E multiples of the groups should converge. Perhaps a correction in the Mag 7stocks could happen along with a broadening market, where the rest of the market goes down less than Mag 7 while providing competitive returns when the market turns back up. Through Q2 2025, the S&P 493 has provided solid returns with lower volatility than the Mag 7 (as seen in Figure 2), and this is likely to persist if earnings grow as expected.

Short-Term Volatility, Medium-Term Stability, Long-Term Growth
After an initial selloff following “Liberation Day,” markets seem to be shrugging off the potential impact of tariffs, though uncertainty remains. Until we have more clarity on the tariff impact on corporate earnings and economic growth, market volatility will likely continue. In the meantime, investors may view the Mag 7 as a safe haven.
Long term, we believe that tariffs should, on balance, be a good thing for U.S. markets. Lowering trade barriers that other countries put in the way of U.S. exporters should boost their prospects. Reshoring, onshoring or nearshoring would also likely be a positive driver of economic growth and employment, and tariffs may ultimately generate significant income for the Treasury (more than $125 billion through July 20254). Finally, newly permanent lower tax rates should provide more certainty and incentives for economic activity. With (hopefully) improved economic growth, better export prospects, higher employment and more stable and predictable supply chains, the market could rally strongly.
Click below to continue reading Conning’s Viewpoint, “Equities, Volatility and the ‘Nifty 50’: A Market Outlook."
About Conning
Conning (www.conning.com) is a leading investment management firm with a long history of serving insurance companies and other institutional investors. Conning supports clients with investment solutions, risk modeling software, and industry research. Founded in 1912, Conning has investment centers in Asia, Europe and North America. Conning is part of the Generali Group.
Legal Disclaimer
©2025 Conning, Inc. Conning, Inc., Goodwin Capital Advisers, Inc., Conning Investment Products, Inc., a FINRA-registered broker-dealer, Conning Asset Management Limited, and Conning Asia Pacific Limited (collectively “Conning”) and Octagon Credit Investors, LLC, Global Evolution Holding ApS and its subsidiaries, and Pearlmark Real Estate, L.L.C. and its subsidiaries (collectively “Affiliates” and together with Conning, “Conning & Affiliates”) are all direct or indirect subsidiaries of Conning Holdings Limited which is one of the family of companies whose controlling shareholder is Generali Investments Holding S.p.A. (“GIH”) a company headquartered in Italy. Assicurazioni Generali S.p.A. is the ultimate controlling parent of all GIH subsidiaries. This document is copyrighted with all rights reserved. No part of this document may be distributed, reproduced, transcribed, transmitted, stored in an electronic retrieval system, or translated into any language in any form by any means without the prior written permission of Conning & Affiliates. Conning & Affiliates do not make any warranties, express or implied, in this document. In no event shall any Conning & Affiliates company be liable for damages of any kind arising out of the use of this document or the information contained within it. This document is not intended to be complete, and we do not guarantee its accuracy. Any opinion expressed in this document is subject to change at any time without notice. This document contains information that is confidential or proprietary to Conning & Affiliates. By accepting this document you agree that: (1) if there is any pre-existing contract containing disclosure and use restrictions between you or your company and any Conning & Affiliates company, you and your company will use the information in this document in reliance on and subject to the terms of any such pre-existing contract; or (2) if there is no contractual relationship between you and your company and any Conning & Affiliates company, you and your company agree to protect the information in this document and not to reproduce, disclose or use the information in anyway, except as may be required by law.
This document is for informational purposes only and should not be interpreted as an offer to sell, or a solicitation or recommendation of an offer to buy any security, product or service, or retain Conning & Affiliates for investment advisory services. The information in this document is not intended to be nor should it be used as investment advice.
Copyright 1990-2025 Conning, Inc. All rights reserved.
COD00001529
Footnotes
1 Source: ©2025 FactSet Research Systems, Inc. – used with limited permission.
2 Source: (c) 2002-25, With Intelligence, Ltd., Fesenmaier, Jeff, Smith, Gary, “The Nifty-Fifty Re-Revisited,” The Journal of Investing, p. 11, 86–90 - used with permission.
3 Ibid
4 Source: “Are Trump’s tariffs making money? Watch this chart.”, Politico Interactive Staff, Politico.com, https://www.politico.com/interactives/2025/trump-tariff-income-tracker/